
CSS Classes, Ids
SciChart.js adds ids and classes to all DOM elements, such as the parent chart root div, canvas and svg, which makes styling of these chart elements easier.
Root Elements or SciChart.js layers
When we create a new SciChartSurface using:
This will create a SciChartSurface and add to the <div> with id="chart" in your HTML DOM.
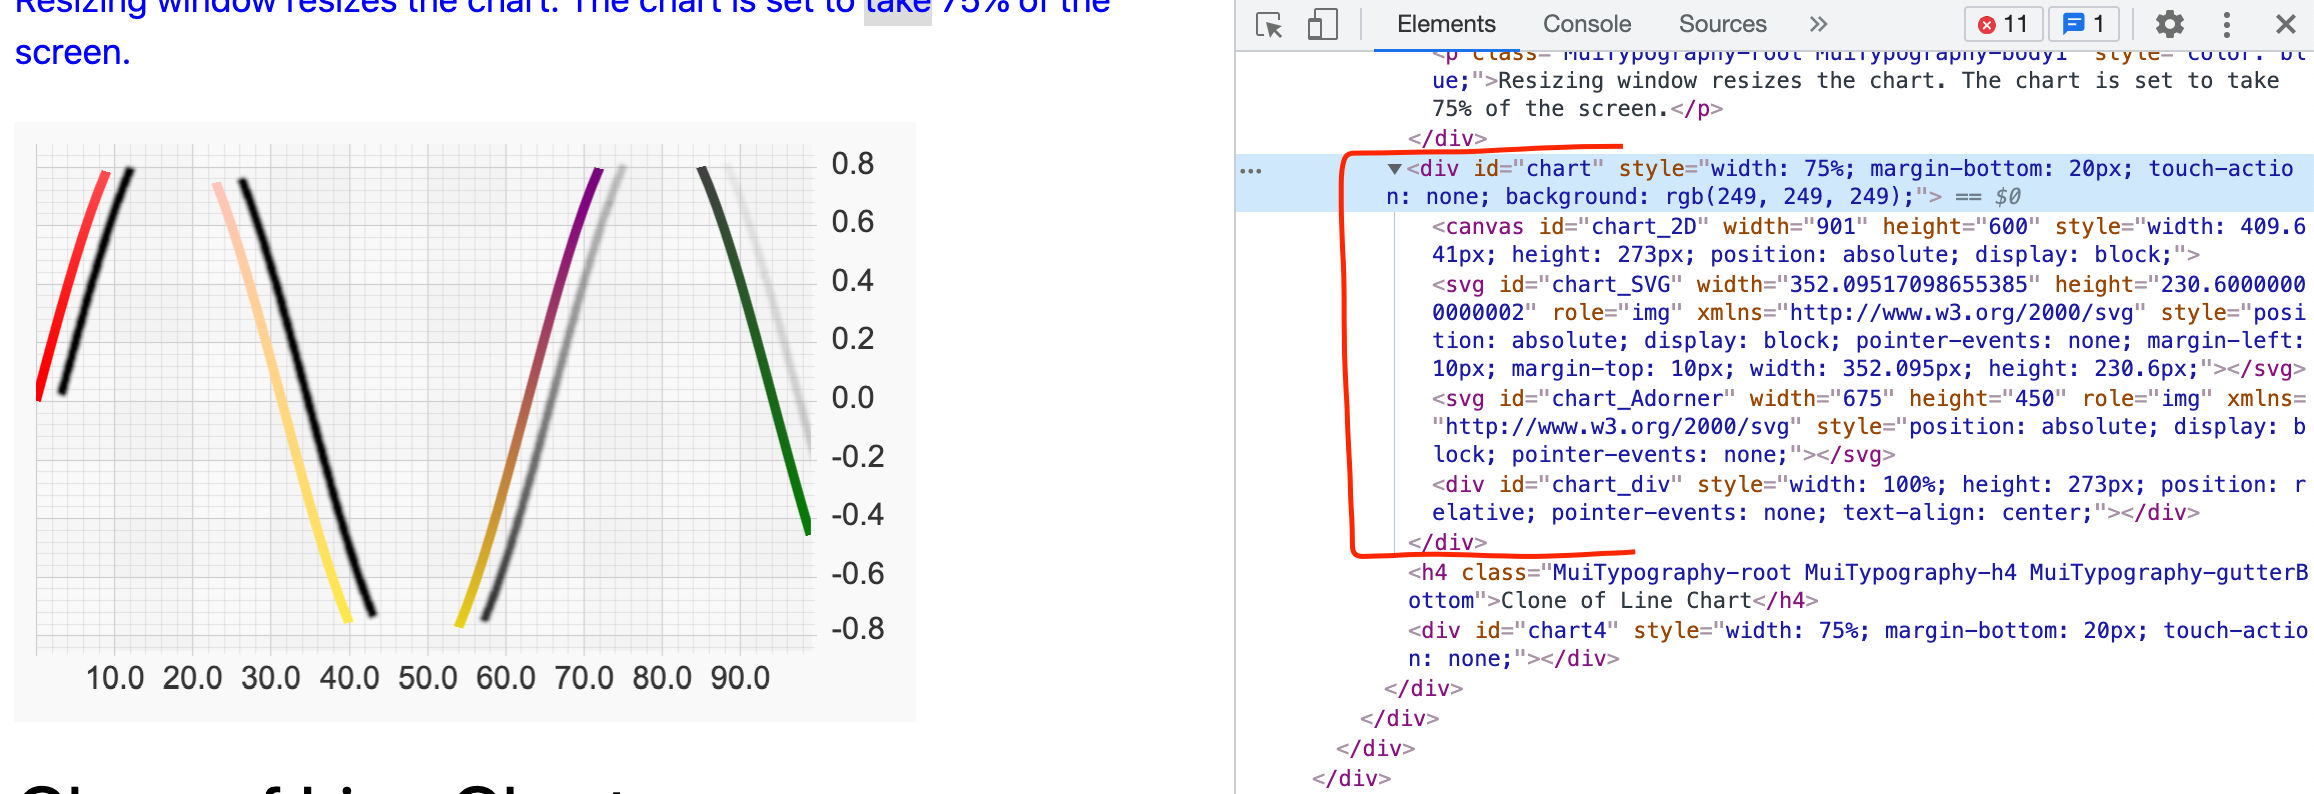
The following child elements are then added to the div:
- Canvas 2D with Id=chart_2D, which is used to draw with render context
- SVG layer - SVG element with Id=chart_SVG, which is used to draw SVG annotations (CustomAnnotation, TextAnnotation).
- Adorner layer - SVG element with Id=chart_Adorner, which is used to draw annotation adorners when an annotation is selected.
- HTML layer - div element with Id=chart_div, which is used to draw legends (LegendModifier)
- The prefix is always the string you pass into the SciChartSurface.create method.
Autogenerated Classes for Child Elements
Each DOM element which might need styling has class attribute which uses BEM approach for naming.
Right now we have following classes:
-
Legend: Id=scichart__legend
-
CursorModifier Tooltip: scichart__cursor-tooltip
-
RolloverModifier tooltip: scichart__rollover-tooltip
-
TextAnnotation: scichart__text-annotation
Classes may consist of three parts, for example scichart__legend__blue, where scichart is block, legend is element and blue is modificator.